Why PageSpeed says 68 on mobile and 96 on desktop
We ran the same page twice on the same machine, thirteen seconds apart. It scored 90, then 85. Then Google's own servers gave it 68 while calling it the same test. Four numbers, one page, fifteen minutes, nothing changed in between.

What happened. On 7 August we measured the cittago.com homepage with PageSpeed Insights, then ran the identical tool from our own server ten minutes later. Performance came back 68, then 90. On desktop, 96 and 99. We changed nothing in between.
Who can skip this. If your report shows real-user data in the box at the top — the one that says "No Data" on ours — read that instead. Field data beats every simulation, including this article.
Why it is worth your time. The mobile number is probably the single most common reason marketing budgets get spent in the wrong place. This is where it comes from, how far it drifts, and which two rows in the report are worth more than the big circle.
- How far the same page drifts between two machines: we measured it, it is 22 points.
- How far it drifts between two runs on one machine, thirteen seconds apart.
- Which metric carries 30% of the grade, and why almost nobody looks at it.
- What is actually heavy on our homepage, in bytes, with the arithmetic on the table.
Here is the fact that should change how you read every speed report you are ever sent. We measured our homepage from our own server, waited thirteen seconds, and measured it again. Same machine, same command, same URL. The first run scored 90. The second scored 85.
Five points is the width of the gap between a green report and an amber one when you are sitting near 90. And we did not do anything in those thirteen seconds except wait.
An hour earlier, Google's own infrastructure had given the same page a 68.
We do page speed optimisation for clients and we keep a free website speed test online, so we read these reports every day. The new Cittago site went live on 6 July 2026, the first article is from 12 July, and the serious content work started on the 27th. A young site with its flaws in daylight is a better subject for this than an invented example.
What the performance score actually is
Definition. The PageSpeed Insights performance score is the 0–100 grade Lighthouse gives to one load of one page, simulated on a cheap phone over a slow network, by combining five timing measurements into a weighted average.
Every clause matters. One load — not an average of the week. One page — not the site. Simulated — no human was involved. Cheap phone, slow network — it is a stress test, not your customer's Tuesday.
Google documents the colour bands: 0–49 red, 50–89 amber, 90–100 green (Lighthouse scoring documentation). A 68 lands in the middle of amber, which is the widest band and the most stressful, because it tells you neither that you are fine nor that you are in trouble.
One consequence is worth stating plainly, because it decides how much any of the rest matters. The Lighthouse performance score is not a Google ranking factor. What the ranking systems use are Core Web Vitals measured on real visitors — field data, not this simulation. You can sit at 62 in the lab and have all three field vitals green.
Thirty per cent for a metric you never look at
The big number is not a measurement. It is a weighted average of five measurements, and the weights are public and worth learning, because they tell you where effort pays.
| Metric | Weight | In plain words |
|---|---|---|
| Total Blocking Time | 30% | How long the page ignores your taps because the phone is busy running code |
| Largest Contentful Paint | 25% | When the biggest thing on the first screen shows up — usually the hero image or the headline |
| Cumulative Layout Shift | 25% | How much the page dances while it loads, moving the button out from under your thumb |
| First Contentful Paint | 10% | When the first pixel of anything appears |
| Speed Index | 10% | How quickly the visible part fills in, overall |
Weights published by Google in the Lighthouse scoring documentation, read on 7 August 2026. Google has changed these weights before and may change them again: check the page before you build a decision on them.
The top row surprises everyone. The single heaviest factor is not how fast the page appears — it is how long the page stays deaf to your taps. Thirty per cent of the grade for something almost nobody reads, because it sits at the bottom right of the report and is written in milliseconds.
It also has an uncomfortable practical edge. Compressing images is the easiest and most visible work available, and it touches 25% of the grade at best. The code that runs at start-up touches 30%, and it is usually not code you wrote.
Four numbers for one page, fifteen minutes
So that is the instrument. Here are the readings it gave us, on one page, inside a quarter of an hour.
Two runs on PageSpeed Insights at 13:32, mobile and desktop. Then four Lighthouse runs from our own server — the same engine PageSpeed Insights runs inside — between 13:42 and 13:45.
| Who measured | Mode | Score | LCP | Blocking (TBT) | Time |
|---|---|---|---|---|---|
| PageSpeed Insights | mobile | 68 | 7.0 s | 190 ms | 13:32 |
| Our own server | mobile, 2nd run | 85 | 2.7 s | 420 ms | 13:42 |
| Our own server | mobile, 1st run | 90 | 1.8 s | 340 ms | 13:42 |
| PageSpeed Insights | desktop | 96 | 0.7 s | 150 ms | 13:32 |
| Our own server | desktop | 99 | 0.8 s | 0 ms | 13:43 |
Source: two PageSpeed Insights reports for https://cittago.com/ on 7 August 2026 (screenshots below) and four Lighthouse 13.4.1 reports generated in a container on our own server the same day. No change was made to the site between the first and the last run. Rows are ordered from the lowest score to the highest.
Twenty-two points between two mobile measurements of the same page, ten minutes apart, on the same version of the same tool. So when someone forwards you a screenshot with "your site is slow" in the subject line, the first useful question is not what to fix. It is who ran it, and from where.
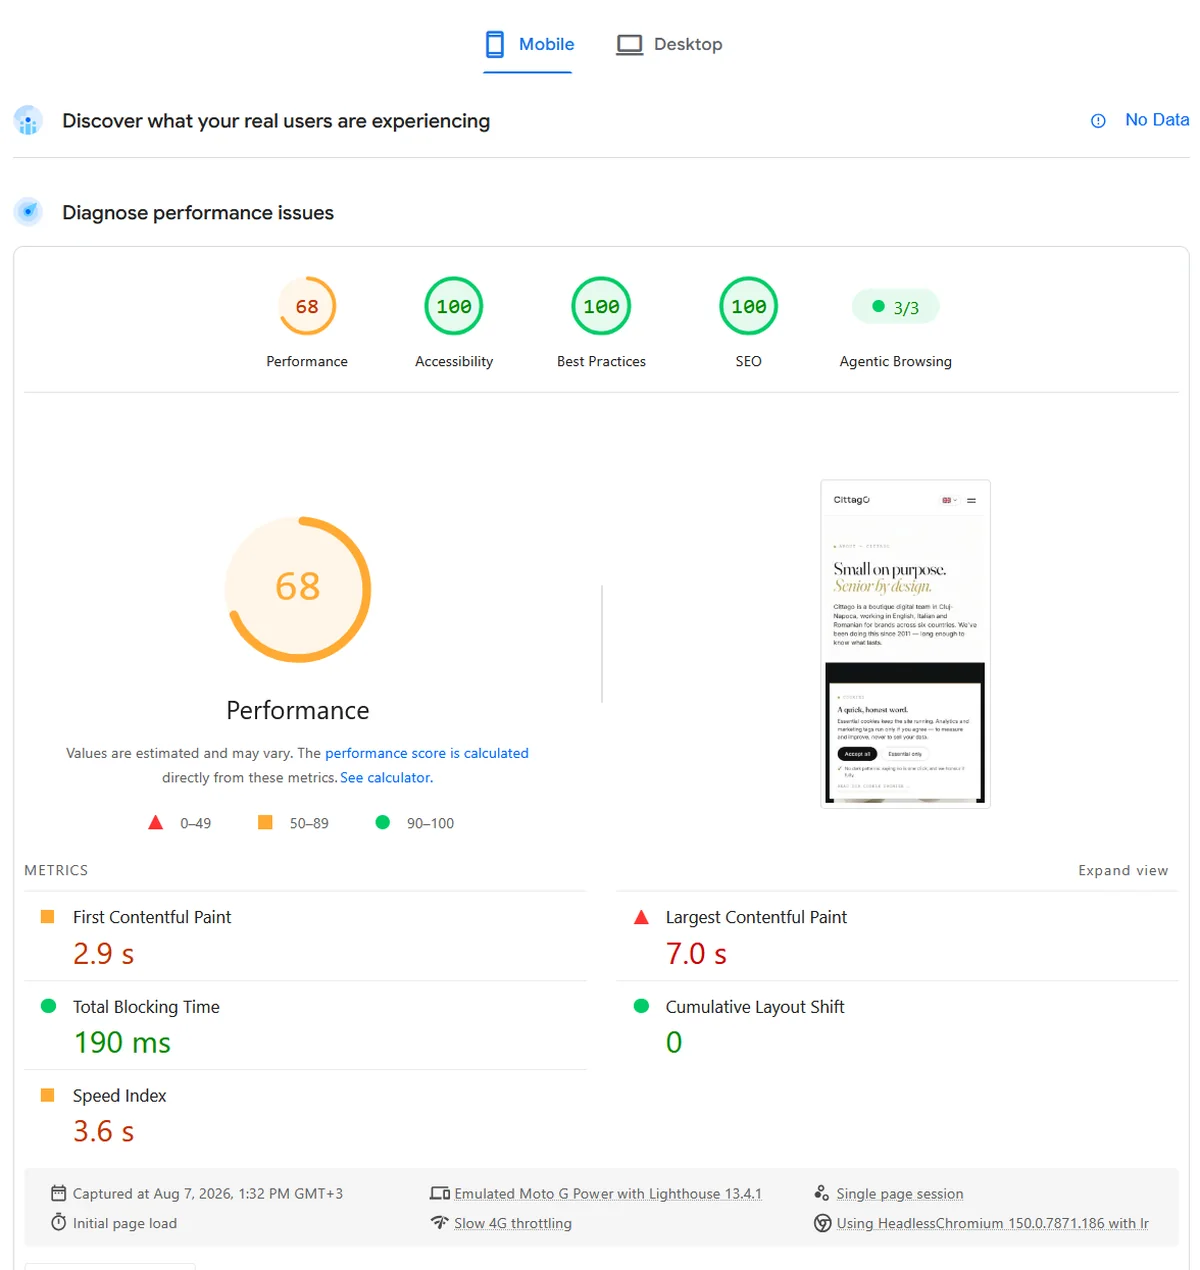
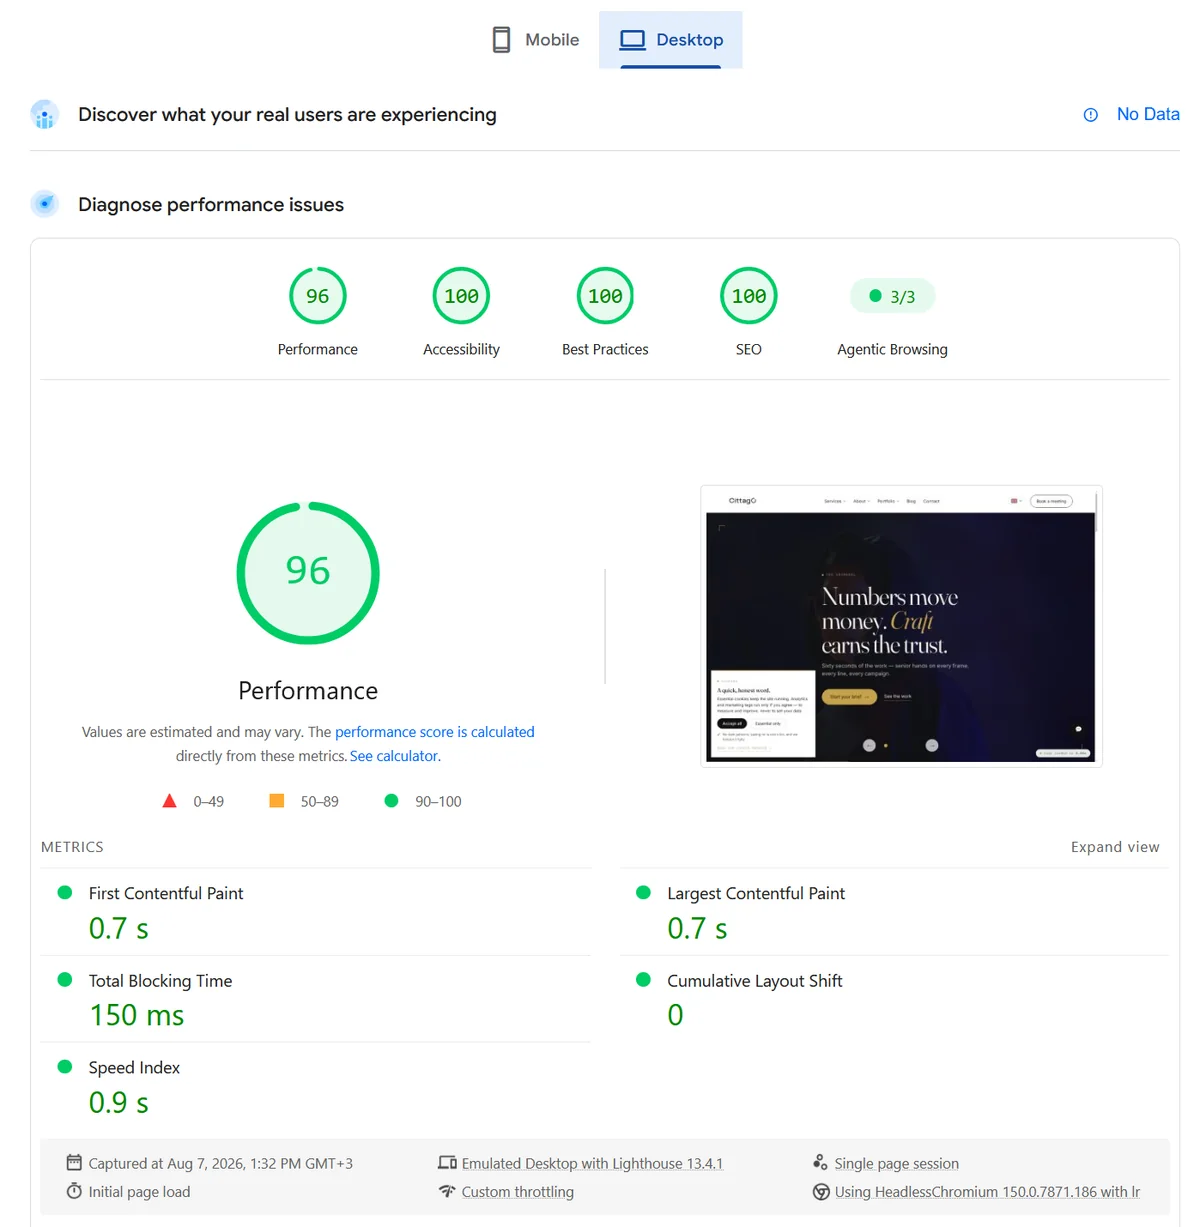
Look at those other three columns for a second. Accessibility 100, best practices 100, SEO 100, identical across both runs. Those categories are checklists: the attribute is either there or it is not. Performance is not a checklist. Performance is a stopwatch, and a stopwatch depends on who is running.
Accessibility, SEO and best practices tell you what you built. Performance tells you how one particular load went, once.
Why the score changes on every run: 90, then 85
Back to the two consecutive runs, because they are the cheapest lesson in this article.
Largest Contentful Paint went from 1.8 to 2.7 seconds. Blocking went from 340 to 420 milliseconds. Same container, same URL, same command, thirteen seconds apart.
Google lists traffic routing, device differences, browser extensions and even antivirus software among the causes of this variance. We would add a duller one that we see constantly: the machine doing the measuring is also doing other things.
Put as one number: on the same machine, thirteen seconds apart, the score moved 5 points; between two machines running an identical configuration, it moved 22. That is the drift you are arguing with when someone forwards you a screenshot.
Which gives the rule that saves the most time in this whole field: run it three times and take the middle one. Run it once and you are measuring the noise as well as the site, and then you spend an afternoon hunting the cause of five points that were never there.
Why the mobile score is lower: two machines, two bottlenecks
The two mobile runs used the same configuration, and not approximately — it is written inside the reports. Emulated moto g power (2022), 412×823 screen, network simulated at 150 ms latency and roughly 1.6 Mbps, processor slowed four times. Lighthouse 13.4.1 on both.
The results still disagree, and the interesting part is that they are not contradicting each other. They are describing two different bottlenecks.
| Metric | PageSpeed Insights | Our own server | What it says |
|---|---|---|---|
| Processor blocking (TBT) | 190 ms | 340 ms | Google's machine had the faster processor of the two |
| Largest Contentful Paint | 7.0 s | 1.8 s | But the page reached it almost four times more slowly |
| First Contentful Paint | 2.9 s | 1.7 s | Even the opening frame arrived later |
| Final score | 68 | 90 | Delivery delay outweighs raw processing power |
Comparison between the mobile PageSpeed Insights report of 7 August 2026 and the first mobile Lighthouse run of the same day from our own server. Emulation and throttling settings are identical; what differs is the physical machine and the network distance between the measurer and the site.
In plain terms: Google's machine chewed through the JavaScript faster than ours did, but the page arrived at it much more slowly in bytes. And because the largest element's arrival carries 25% of the grade, that delay eats the score.
Why does delivery vary that much? Because between the measurer and your server sit distance, a CDN and, almost always, some security checks. Those are the same three things that differ between a customer on a commuter train and a customer on office fibre. It is not a flaw in the test — it is the piece of reality the test includes and you do not control.
Only compare scores that come from the same source. Today's PageSpeed Insights number compares to last Tuesday's PageSpeed Insights number, not to the one your agency ran from a laptop. They are two different thermometers, and neither one is broken.
The row that says "No Data"
At the top of the report there is a box called Discover what your real users are experiencing. On ours, in both modes, it says No Data.
That box is the only part of the report about actual people. It holds what Chrome collected from real visitors to your site over the last 28 days, and it only appears when there is enough traffic to make the sample trustworthy. Our site is a month old. There is not.
So all four of our numbers are simulations. They are useful — a repeated simulation tells you whether a change helped or hurt — but not one of them is a customer's experience.
1. Field data (the top box, when it exists): what actually happened to your visitors. Beats everything.
2. Lab data (the score): a repeatable test, good for before-and-after.
3. One number taken once: an anecdote.
If you have traffic and the box is populated, your work is there. If the box is empty like ours, the lab score is what you have, and you use it for what it is good at: comparing one page against itself, always measured the same way.

What Google Tag Manager costs: 51.6% of our homepage
So far this has been about how much the score depends on who measures. Now the part that depends on us, with the bytes counted.
In the 13:42 run, our homepage downloaded 950,782 bytes across 28 requests. Here is where they came from.
| Origin | Bytes | Share | What it is |
|---|---|---|---|
| googletagmanager.com | 491,069 | 51.6% | Tag Manager, Google Analytics 4 and the Google Ads tag |
| cittago.com | 446,841 | 47.0% | The page, the fonts, the images, our own code |
| static.cloudflareinsights.com | 11,577 | 1.2% | CDN analytics |
| Two more Google domains | 1,295 | 0.1% | Data collection calls |
Source: the network-requests section of the Lighthouse report generated from our own server on 7 August 2026 at 13:42 for https://cittago.com/. Bytes are transfer size, already compressed.
More than half the weight of our homepage is tooling that measures rather than shows. The three largest files on the page are, in order, the Analytics tag (191 KB), the Google Ads tag (181 KB) and the Tag Manager container (119 KB). The HTML document, for comparison, is 56 KB.
What happens if you take them out? We did that at 13:45, same machine, same command plus one line that blocks the domain.
| Same page, same machine | With the tags | Without the tags |
|---|---|---|
| Performance score | 90 / 85 | 95 |
| Processor blocking (TBT) | 340–420 ms | 200 ms |
| Time to interactive | 6.8 s | 3.7 s |
| Total weight | 950 KB | ~460 KB |
Lighthouse 13.4.1 mobile runs from our own server, 7 August 2026, at 13:42 and 13:45. The "without the tags" column comes from blocking requests to googletagmanager.com; total weight is the measured total minus that domain's share.
Five points of score and three seconds off the moment the page starts answering taps. And here is the unheroic part: we are keeping the tags. They tell us which pages produce enquiries and which do not, and that is worth more to us than five points on a simulated stopwatch.
It is a choice, not an oversight. But it should be a choice made with the number in front of you rather than out of habit. The right question is not how to reach 100. It is what you are buying with the points you are spending. If you have three remarketing tags still firing for campaigns that ended last year, you are paying for them on every phone that opens your site.
What the score does not tell you
| What it measures | What you cannot conclude |
|---|---|
| One load of one page | Nothing about the rest of the site. Your checkout can be twice as slow as your homepage. |
| A simulated phone on a slow network | Not your customer's phone. Could be worse, could be far better. |
| A first visit, with an empty cache | Returning visitors already hold your fonts and images and see something else entirely. |
| A number from 0 to 100 | Not a ranking factor. Google uses field data, not your lab score. |
| Our runs from our own server | Measuring your own site from your own machine is convenient and a little flattering: you are close by, and sometimes allow-listed. Do not treat it as proof of speed for the world. |
That last row applies to us too, which is why the ugliest number in this article — 68 — is Google's and not ours. Publishing only the 90 we measured in-house would have made for a more comfortable article and a less true one.
What you need to run this yourself
Everything above is reproducible today, on your own site, with nothing to install. You need:
- The exact address of the page that earns money. Not the homepage out of habit: the product page, the service page, the contact form.
- Two minutes to run it three times instead of once, and take the middle result.
- Somewhere to write the five numbers down, with the date. A spreadsheet is plenty. Without a history, every measurement is day one.
- The same source every time. If you start with PageSpeed Insights, stay with PageSpeed Insights.
- Chrome on your own machine, if you also want the local version: the Lighthouse panel lives in the developer tools and measures from your network.
If you would rather have the summary pre-chewed, our free website speed test runs the check and hands back the numbers with the explanation beside them, no sign-up.
How to read a report in ten minutes
- Look at the top box first, the real-user one. If it has numbers in it, the rest of the report is secondary — work on those.
- Run it three times, take the middle. One run is not a measurement, it is an impression.
- Ignore the circle, read the five rows. The big number does not tell you what to do; the metrics do.
- Start with blocking time. It carries 30% and it is nearly always third-party code: tags, chat widgets, cookie banners, review embeds.
- Then the largest element. Nine times out of ten it is the image at the top. If it is a video or a carousel, you have found your afternoon.
- Watch the filmstrip. Two blank frames at the start means waiting for delivery; a page that assembles in jerks means code.
- Measure the page that earns money, not the homepage, and re-measure after every change — one change at a time, or you will not know which one counted.
The words, in a table
| Term | What it means |
|---|---|
| Lighthouse | Google's program that runs the test. It runs inside PageSpeed Insights, inside Chrome, and from the command line. |
| PageSpeed Insights | The public site that runs Lighthouse on Google's servers and shows you the report. |
| Lab data | A simulated, repeatable test with no real users in it. |
| Field data | What Chrome collected from real visitors over the last 28 days. |
| Core Web Vitals | The three metrics Google treats as primary: LCP, INP and CLS, documented by Google here. The Lighthouse score uses a different set. |
| Throttling | The artificial slowing of network and processor that makes the test strict and comparable. |
| Emulation | Chrome pretending to be a phone: screen size, pixel density and device name. |
Where you stand, in three thresholds
If the real-user box is populated and your values are green, you are done. The lab score is trivia. Go back to selling what you sell.
If the box is populated and the values are red, you have a real problem, and you have it with people rather than with a simulator. Start with the worst metric and do not look at the score until you have moved it.
If the box is empty like ours, you are in the lab. That is fine: pick one source, run three times, write down the five numbers with the date, and repeat after every change. In a month you will have a line, and a line is worth ten screenshots.
Our box will fill up when there is enough traffic. On that day we will publish the real numbers next to these ones and see how wrong we were. Let's talk again in three to six months 😉
Questions
Questions nobody has actually asked us
Nobody has written in to ask: the article went up today. These are the questions a reader would have, plus the ones that come up in client conversations whenever the amber screenshot lands.
Is the Lighthouse performance score a Google ranking factor?
The score itself is not. What Google uses in ranking is Core Web Vitals measured on real users — the box at the top of the report, not the big number underneath it. They are different things: you can sit at 62 in the lab and have all your field vitals green.
Which means, bluntly, that chasing the green circle is often work spent in the wrong place.
Where does INP fit into this score?
It does not, directly. Interaction to Next Paint is a field metric: it needs a real person tapping real things, and a lab run has nobody in it. Lighthouse uses Total Blocking Time as its lab stand-in for the same problem, which is exactly why blocking carries 30% of the grade.
So improving blocking time in the lab is the closest thing you have to improving INP before you have field data.
What score should a business site aim for?
Green starts at 90 and is a fair target for a content page. On an e-commerce site with a chat widget, review embeds, ad pixels and a cookie banner, holding above 80 on mobile is already a good result.
More useful than the absolute value is the direction: where you were last month and where you are now, measured the same way both times.
I ran it twice and got two different numbers. Did I do something wrong?
No, that is normal. Our two consecutive runs, thirteen seconds apart on the same machine, produced 90 and 85.
The difference comes from network conditions in the moment, load on the measuring machine, and a hundred details that shift between two page loads. That is why you run three and take the middle one.
Should I remove Google Analytics to gain points?
You can, and the gain is measurable: on our site, blocking the tags moved the score from 90 to 95 and cut three seconds off the moment the page becomes responsive. But then you no longer know where your enquiries come from.
The sensible move is an inventory: which tags you have, what each one is for, who looks at that data. Anything nobody has opened in six months is pure weight.
Does the cookie banner hurt my score?
Often, in two ways. It is code that runs at start-up, so it lands in the blocking time that carries 30%. And if it covers the screen it can become the largest element on the first view, which is the thing the stopwatch waits for.
That is not a reason to remove it — consent is not optional. It is a reason to pick a light one and load it properly.
Is my hosting slow, or is it the site?
One row of the report nearly answers this by itself: server response time, meaning how long the first part of the document takes to arrive. In our run it was 30 milliseconds.
If that number is high and everything else looks reasonable, the problem sits upstream of the site. If it is low and the score is still amber, the problem is what the site does after it arrives.
Can I benchmark a competitor?
Yes, and it is one of the few honest comparisons available, because PageSpeed Insights works on any public address. With one caveat: do it the same day, with the same tool, on comparable pages — product page against product page, not their homepage against your checkout.
And run theirs three times too, or you are comparing your average against their bad afternoon.
Are images really the main problem?
They are the first problem that is easy to see, not necessarily the first that matters. Images mostly affect the largest element's arrival, which carries 25%. Start-up code affects blocking time, which carries 30%.
That said, a three-megabyte image at the top of the page is still the fastest way to ruin everything, and fixing it takes ten minutes.
Where do I start if I have one afternoon?
In order: inventory the tags and delete the dead ones; check that the image at the top weighs under about a hundred kilobytes and is not hidden behind a fade-in animation; measure three times before and three times after.
If you are still amber after that, the problem is structural and an afternoon will not solve it. But at least you know it was never dust — that is where our page speed work starts, with the same sequence of measurements.
Last updated: 7 August 2026. The figures come from two PageSpeed Insights reports for https://cittago.com/ run on 7 August 2026 at 13:32 (GMT+3) and from four Lighthouse 13.4.1 reports generated in a container on our own server between 13:42 and 13:45 the same day. Metric weights are those in the Lighthouse documentation as read on that date. We update this page when the weights change, or when our own report stops saying "No Data".